Market To Crash!! – This Chart Says A 1987 Black Monday Could Happen In Days
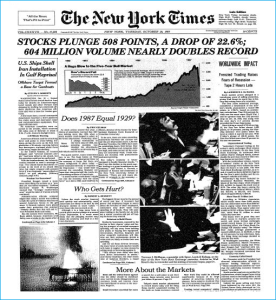
After more than doubling from 1982 to 1986, the Black Monday on October 19, 1987 finally sent stock markets around the world crashed. On that fateful day, The Dow Jones Industrial Average (DJIA) fell approximately 508 points to 1,738.74 (22.61%). The terms “Black Monday” and “Black Tuesday” are also used on October 19 and October 20, 1929 – the Great Depression.
By the end of October 1987, stock markets in Hong Kong, Australia, Spain, United Kingdom, United States and Canada had fallen between 45.5%, to 22.5%. New Zealand’s stock market suffered 60% from its 1987 peak. The Black Monday decline remains – until today – the largest one-day percentage decline in the DJIA.
Now, do you understand why fund managers do not normally buy stocks on Friday, or at least do not buy as much as normal days, before the weekend kicks in? That’s because if another “Black Monday” happens, clients would lose their shirts before the opening bell. Of course, that’s particularly true if the world is in crisis, like what is happening in the Middle East and South China Sea now.
Saturday and Sunday could make a lot of difference. A war could start or a program trading could sell like mad. Or speculators such as George Soros could simply dump his portfolio in the market, creating panic selling. Fund managers could be working hand in glove with each others and even speculators to even suppress the already tumbling stock market.
The first lesson every trader and investor must learn, besides 30 investing tips and tricks never taught at school, is to never underestimate the force of selling. And technical analysts or chartists have been working really hard to predict the next crash. They would show you tons of charts about the next recession, depression or simply a major correction.
Hey, don’t blame them. As so-called technical analysts or specialists, they too are under pressure to prove to their boss and clients that they are indeed the experts. Part of their job functions is to raise alarm – regardless whether true or false – so that they won’t look like fools when the market really crashes for real.
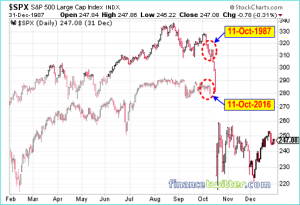
One of the methods these experts use to predict the next stock market Armageddon is exploring patterns which resemble the 1987 Black Monday. Sure, history doesn’t repeat itself but it often rhymes. Therefore, based on the chart above, whispers are getting louder that we might be at the centre of a 1987 Black Monday crash anytime now.
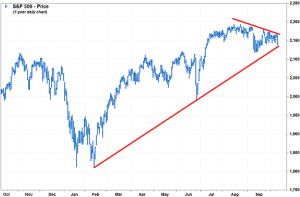
Although 19 October doesn’t fall on Monday this year, analysts are still spooked by the 2016 chart since February, which eerily looks like the 1987 chart before the market crash. To make it more dramatic, technical analysts are seeing a “symmetrical triangle” on a number of time scales for S&P 500. If it breaks and moves downward, it could plunge like what happened in 1987.
Thanks to the coming 2016 Presidential Election, some analysts believe a market crash could be ruled out. Still, the fact remains that the U.S. economy is as rosy as Obama administration would like people to think. One glaring proof is the refusal of Federal Reserve Chair Janet Yellen to raise interest rate, although her boss President Obama tells all and sundry the U.S. economy is booming.
Here’s another simplest indicator that the U.S. economy is indeed very fragile. The interest rate is now at an insane low level – almost zero. Sadly, despite easy money, the American business owners and consumers do not feel the economic growth is booming as it should be. Millions of Americans are still struggling financially.
And there’re rumours that the U.S. may follow Japan and European countries such as Germany who offer negative interest rate. What this means is low interest rate is not working at all in pushing the world’s economic growth. What is needed to spark a major selloff is some large fund managers decide to take profit because the chart says the 1987 crash is coming.
Other Articles That May Interest You …
- Here’s Everything About Deutsche Bank Crisis – And Why Merkel Would “Quietly Bailout” Her Bank
- Soros Will Lose All His Money On “Put Options” If Bull Market Continues
- Losing Faith In China & Hong Kong – Superman Li Ka-shing To Sell “The Center”
- Market Crash! “Sell Stocks”, “Buy Gold” – Soros Has Profited $90 Million So Far
- Soros – We’re About To See Something That Hasn’t Happened in “80 Years”
- Flashback Of 1997 & Today’s Financial Crisis – Here’s Why You Should Be Scared
- A Remaking Of 1997 Asian Financial Crisis By Najib Razak In 2015
- Soros Bet $2.2 Billion On SPY Puts – Does He Know Something We Don’t?
- 30 Investing Tips & Tricks You Won’t Learn At School
from FinanceTwitter http://www.financetwitter.com/2016/10/market-to-crash-this-chart-says-a-1987-black-monday-could-happen-in-days.html


Post a Comment